
Washington’s Uneven Hospital Landscape: How Price Levels Vary Statewide
Contributed by Drew Oliveira, MD, MHA
Executive Director
Washington Health Alliance
Original Publish Date: July 9, 2024
Overview
In the face of a mounting health care affordability crisis, transparency in hospital pricing, representing about a third of the total healthcare dollars,1 has become a substantial concern among those who pay for and receive health care services across Washington state.
In a May 2024 analysis, which includes a large volume of data from self-insured employers in Washington state, we found hospitals ranging from 150 percent to nearly 700 percent of the price of Medicare. On average, Washington hospitals price levels are 288 percent of what Medicare pays.
The price levels reported by the Alliance offer an independent view into the billions of dollars spent annually in acute care hospitals and outpatient facilities. For a more comprehensive view, our report includes cancer facilities, children’s hospitals, as well as the two dozen critical access hospitals spread across our state.
This report provides a summary of the stark differences in hospital price levels across county lines or in the same city. Starting with the prices hospitals receive from commercial purchasers is a step toward finding a “fair price.”
We must dive deeper to understand how healthcare purchasers, plans and providers can work together and with policymakers to better stymie rising costs by addressing the realities of hospital pricing. Hospitals should be paid for the actual cost to deliver the service plus a reasonable margin for profit. To ensure everyone benefits, the service must be high quality, and patient safety is a must.
Key Findings
This first-ever report from the Washington Health Alliance offers several findings that merit further research and can inform efforts to address the rising cost of care across our state.
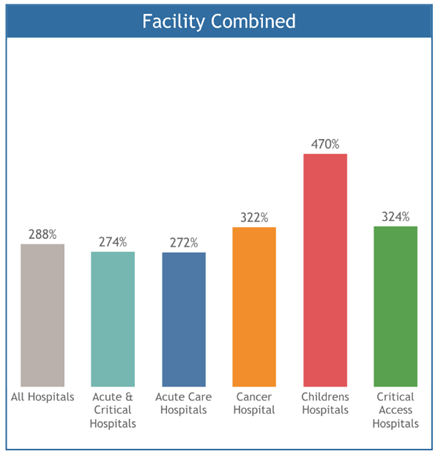
- For all types of hospitals, the average price level for services provided in hospitals statewide is 288 percent of Medicare.
- The hospital price levels compared to Medicare were highest in children’s hospitals – 470% -- and lowest on average in acute care hospitals – 272%.
- Critical access hospitals, which make up more than one-third of all hospitals in Washington state, on average had hospital price levels that were 324%. However, these hospitals are a small percentage of overall hospital spending. Variations of hospital price levels compared to Medicare were most significant among these critical access hospitals.
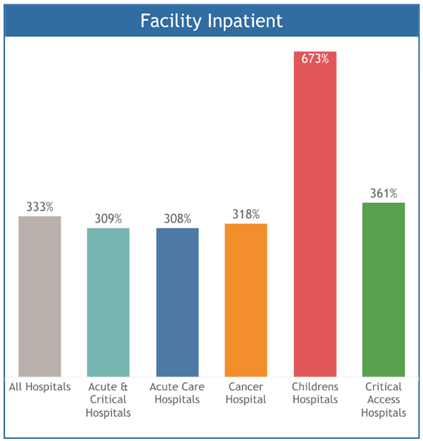
- The average hospital price level was highest in facility inpatient – 333% of Medicare.
Methodology
For this analysis, the Washington Health Alliance relied on calendar year 2022 claim data from our voluntary All-Payer Claim Database, which includes more than 2.2 million commercially insured lives in Washington state. Our data comes from self-insured employers and union trusts, and health plans.
The results in this report are combined for commercial payers in the WHA-APCD. The methodology relies upon privately negotiated contractual prices (known as allowed amounts) and Milliman’s Global Relative Value Units.2
These results are not actual prices but are relative price levels. Specifically, commercial prices are compared to corresponding Medicare prices, and reported as “percent of Medicare.” For example, 200 percent of Medicare means that commercial prices are about twice what Medicare is likely to have paid. The results consider the varying treatment intensity at different hospitals.
The Medicare pricing reference we use is the published Medicare conversion factor for the United States overall. Apart from categorizing hospitals into broad groups such as Acute Care and Critical Access, no other hospital-specific adjustments have been made. Examples of these might include whether a facility is an academic teaching hospital, the share of low-income patients treated, or regional differences in prevailing wages.
The report includes over $3 billion worth of allowed payments.
Service Setting
Utilizing Milliman’s Health Cost Guidelines (HCG) grouper, claims were defined by service setting as “facility inpatient,” “facility outpatient,” and “professional” claims to capture the widest representation of hospital visits.
Claims under the “professional” service setting are those services related to the hospital inpatient or outpatient services to offer a comprehensive view to the total hospital encounter.
Facilities were identified by the Centers for Medicare and Medicaid Services (CMS) certification number and the Washington Health Alliance Master Facility List.
Implications
Our analysis, among the first from an independent organization in Washington state, offers a high-level view of hospital price levels, but much more is needed to understand what a fair price is.
Charity Care, patient medical debt burden: Washington state is home to more than 40 nonprofit hospitals with obligations to provide charity care and give back to their respective communities. While this may contribute to the overall costs to run facilities, a recent Lown Institute report shows that 98% of these hospitals are failing in their charity obligations by a total amount of almost $1 billion.
Rising staffing costs: It would be useful to understand how increasing labor costs impact the hospital price levels given that direct patient care labor costs are only 31% of overall expenses for WA hospitals and non-patient care operating expenses are rising faster than expenses related to providing care.
Plan, service line disparities: Another key area to explore further would be disparities in hospital price levels by service lines within these broad areas such as professional, facility outpatient and facility in patient to get an even more accurate and detailed look into cost drivers in hospitals and differences in pricing levels.
Fair price equation: Ultimately, we need to have more transparency into hospital expenses, their efficiency in delivering care and the cross-subsidization of other business lines paid for as hospital care. To determine what is a fair price ideally, we would want to know the actual cost to deliver that service which is something even hospitals cannot calculate. Paying a facility for actual costs plus a margin for age of the physical plant, innovation, rewarding efficiency may make sense. Today, much of the negotiated pricing is based on leverage of the facility and rewards inefficiency equal to efficiency.
Download the full report (PDF)
1Centers for Medicare & Medicaid Services (CMS) (2022, May 2). National Health Expenditures 2022 Highlights